“mpstat” is a command-line tool that is used to monitor CPU utilization on Linux and Unix-like systems. It provides information about CPU utilization, including the utilization of individual cores, the utilization of individual processes, and the utilization of the system as a whole.
The mpstat command is a part of the Sysstat set of utilities. The mpstat command is used to report per processor statistics in a tabular format.
$ mpstat 1 1

CPU minf mjf xcal  intr ithr  csw icsw migr smtx  srw syscl  usr sys  wt idl
  0  672   0 2457   681   12  539   17   57  119    0  4303   18  10   0  73
  1   90   0 1551   368   22  344    6   37  104    0  3775   17   4   0  79
  2   68   0 1026   274   14  217    4   24   83    0  2393   11   3   0  86
  3   50   0  568   218    9  128    3   17   56    0  1319    7   2   0  92
  4   27   0  907   340   12  233    3   22   72    0  2034    9   2   0  88
  5   75   0 1777   426   25  370    5   33  111    0  4820   22   4   0  74
In the preceding output of the mpstat command, each row of the table represents the activity of one processor. The first table shows the summary of activity since boot time. The important column that is relevant from a DBA’s perspective is the value in the smtx column. The smtx measurement indicates the number of times CPU failed to obtain the mutual exclusion lock or mutex. Mutex stalls waste CPU time and degrade multiprocessor scaling.
A general rule of thumb is if the values in the smtx column are greater than 200, then it is a symptom and indication of CPU bottleneck issues that need to be investigated.
If you encounter the below error while running the command mpstat:
mpstat: command not found
you may try installing the below package as per your choice of distribution:
| Distribution | Command |
|---|---|
| Debian | apt-get install sysstat |
| Ubuntu | apt-get install sysstat |
| Alpine | apk add sysstat |
| Arch Linux | pacman -S sysstat |
| Kali Linux | apt-get install sysstat |
| CentOS | yum install sysstat |
| Fedora | dnf install sysstat |
| Raspbian | apt-get install sysstat |
mpstat Command Examples
1. Display CPU statistics every 2 seconds:
# mpstat 2
2. Display 5 reports, one by one, at 2 second intervals:
# mpstat 2 5
3. Display 5 reports, one by one, from a given processor, at 2 second intervals:
# mpstat -P 0 2 5
Conclusion
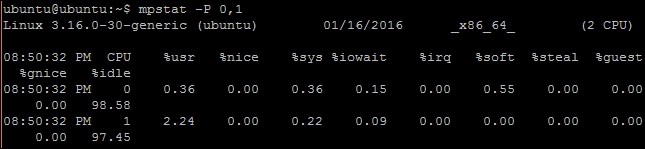
By default, mpstat returns combined averaged stats for all CPUs. Flag -P can be used to get details of specific CPUs. The following command will display statistics for processor one (0) and processor two (1), and update at an interval of 3 seconds:
$ mpstat -P 0,1 3