• Skip to primary navigation
  • Skip to main content
  • Skip to primary sidebar
  • Skip to footer navigation

The Geek Diary

  • OS
    • Linux
    • CentOS/RHEL
    • Solaris
    • Oracle Linux
    • VCS
  • Interview Questions
  • Database
    • oracle
    • oracle 12c
    • ASM
    • mysql
    • MariaDB
  • DevOps
    • Docker
    • Shell Scripting
  • Big Data
    • Hadoop
    • Cloudera
    • Hortonworks HDP

Linux Device Driver example for dump_stack() to print the stack trace of module loading

by admin

One of the useful options in debugging is to print the call trace/stack trace. Linux kernel provides a function to print the stack trace: dump_stack(). The dump_stack function produces a stack trace much like panic and oops, but causes no problems and we return to the normal control flow.

Calling dump_stack() function will print the stack trace at that point.

Code:

#include <linux/module.h>
#include <linux/kernel.h>

static int myinit(void)
{
	pr_info("dump_stack myinit\n");
	dump_stack();
	pr_info("dump_stack after\n");
	return 0;
}

static void myexit(void)
{
	pr_info("panic myexit\n");
}

module_init(myinit)
module_exit(myexit)
MODULE_LICENSE("GPL");
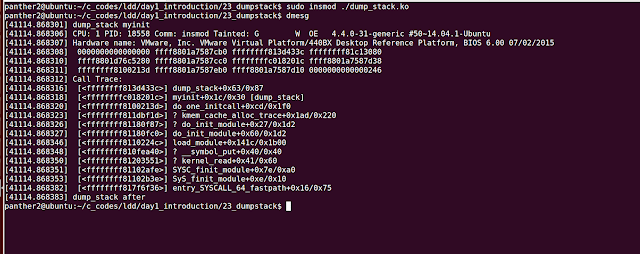
Output:

dump_stack() to print the stack trace of module loading

Filed Under: C, C Library

Some more articles you might also be interested in …

  1. Beginners Guide to C Structures: Definition, creation and manipulation
  2. Basics of C Preprocessors
  3. C Jumping Statements
  4. C Functions
  5. Basics of C programming
  6. C Operators
  7. Introduction to Array in C Programming
  8. Control Structures of C – for, while and do loops, if then else statements, switch statements
  9. Serial Port Programming: tcflush – TCIFLUSH,TCOFLUSH example
  10. C Pointers

You May Also Like

Primary Sidebar

Recent Posts

  • powertop Command Examples in Linux
  • powertop: command not found
  • powerstat: command not found
  • powerstat Command Examples in Linux

© 2023 · The Geek Diary

  • Archives
  • Contact Us
  • Copyright