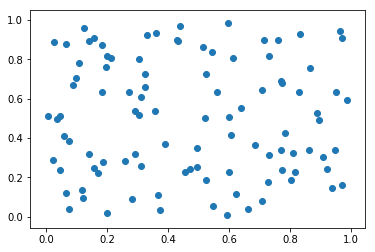
Scatter plot is a basic plot of dots. You can draw it by calling plt.scatter(x,y). The following example shows a scatter plot of random dots:
import numpy as np
import matplotlib.pyplot as plt

# Set the random seed for NumPy function to keep the results reproducible
np.random.seed(42)

# Generate a 2 by 100 NumPy Array of random decimals between 0 and 1
r = np.random.rand(2,100)

# Plot the x and y coordinates of the random dots on a scatter plot
plt.scatter(r[0],r[1])

# Show the plot
plt.show()
The following plot is the result of the preceding code:
The following code was written in python to generate a scatter plot of the test data after splitting it into test and train data. The data being read from a sample file was converted to matrix to be able to use the data for the the linear regression algorithm.
import numpy as np
import matplotlib.pyplot as plt
import pandas as pd

data=pd.read_csv('data_1.csv',encoding='utf-8')
print data.head()

X_data=np.matrix(data['X1'])
Y_data=np.matrix(data['Y1'])
X_train,X_test,Y_train,Y_test=train_test_split(np.transpose(X_data),\
                                    np.transpose(Y_data), test_size=0.3)
plt.scatter(X_test, Y_test,  color='black')
But using the same data for the scatter plot generated the following error.
ValueError: Masked arrays must be 1-D
This is because we are passing X_test and Y_test and matrices to scatter plot but which actually are one dimensional arrays. Thus to get around the problem we can cast the data into an numpy array.
plt.scatter(np.array(X_test), np.array(Y_test), color='black')
The above modification should stop the error from being thrown. The modified code will be.
import numpy as np
import matplotlib.pyplot as plt
import pandas as pd

data=pd.read_csv('data_1.csv',encoding='utf-8')
print data.head()

X_data=np.matrix(data['X1'])
Y_data=np.matrix(data['Y1'])
X_train,X_test,Y_train,Y_test=train_test_split(np.transpose(X_data),\
                                    np.transpose(Y_data), test_size=0.3)

plt.scatter(np.array(X_test), np.array(Y_test),  color='black')