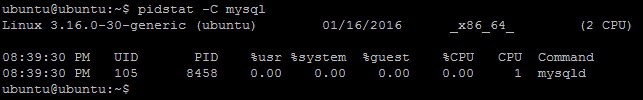
While top is used to get an overview of all running processes, the command pidstat can be used to monitor CPU utilization by an individual process or program. Use the following command to monitor CPU consumed by MySQL (or any other task name):
$ pidstat -C mysql
With pidstat, you can also query statistics for a specific process by its process ID or PID, as follows:
$ pidstat -p 1254
The pidstat application may not be installed by default. It can be installed with this command:
# apt-get install sysstat
or
# yum install sysstat
The pidstat application has several options for generating different reports:
- -d: This reports IO statistics.
- -r: This reports page faults and memory utilization.
- -u: This reports CPU utilization.
- -w: This reports task switches.
pidstat Command Examples in Linux
1. To report statistics for Linux tasks:
# pidstat
2. To display only tasks whose command name includes the string comm:
# pidstat -C comm
3. To report I/O statistics:
# pidstat -d
4. To display all activities horizontally on a single line:
# pidstat -h
5. To display the process command name and all its arguments:
# pidstat -l
6. To select tasks (processes) for which statistics are to be reported:
# pidstat -p 1234
7. To report page faults and memory usage:
# pidstat -r
8. To display statistics for threads associated with selected tasks:
# pidstat -t
9. To specifies what has to be monitored by the pidstat command:
# pidstat -T
10. To report CPU usage:
# pidstat -u
11. To print version info:
# pidstat -V
12. To Report task switching activity:
# pidstat -w
Conclusion
The pidstat application queries the kernel to get task information. The pidstat program will report per-process statistics, which can be sorted to provide more insight.