htop is an interactive process viewer in a UNIX-like operating system. Htop is a free (GPL) ncurses-based process viewer for Linux. It is similar to the top but allows you to scroll vertically and horizontally, so you can see all the processes running on the system, along with their full command lines. Tasks related to processes (killing, renicing) can be done without entering their PIDs.
htop is designed to replace the UNIX top command. It shows a frequently updated list of the processes running on a computer, normally ordered by the amount of CPU usage. Htop uses color and gives visual information about processor, swap, and memory status.
Installation of htop on Ubuntu
To install htop on ubuntu:
# sudo apt-get install htop
Installation of htop on CentOS/RHEL
As htop package is not available in the default repositories , so first enable the epel repository and then use yum command to install htop.
# wget http://dl.fedoraproject.org/pub/epel/6/x86_64/epel-release-6-8.noarch.rpm
# rpm -ivh epel-release-6-8.noarch.rpm
# yum install htop
Synatx
The syntax of the htop command is:
# htop [-dChusv]
Options:
- -d Delay between updates, in tenths of seconds
- -C Start htop in monochrome mode
- -h Display a help message and exit
- -u –user=USERNAME ( Show only the processes of a given user)
- -p Start working thread for pagemap memory stats
- -s –sort-key COLUMN , Sort by this column (use –sort-key help for a column list)
- -v –version (Output version information and exit)
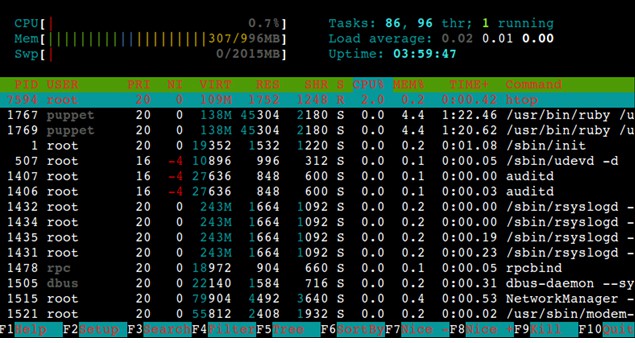
htop output sections
The htop output consists of 3 sections as follow:
- Section 1: Header shows the CPU usage , Memory usage & Swap usage along with Load average and uptime of linux box.
- Section 2: Body shows the list of processes sorted by %CPU usage.
- Section 3: Footer displays htop menu commands.
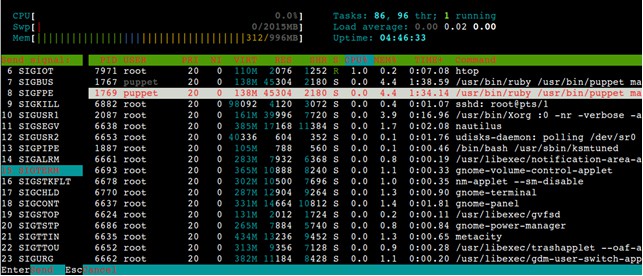
Kill process without leaving htop
To kill a process, first select the process and then press F9 or k and then click on send to kill the process, in my case I am killing the puppet process as shown below:
Display the processes sorted by different options
By default htop shows the process sorted by CPU usage, if you want to change the sorting option, then press F6 and select your respective Options as shown below:
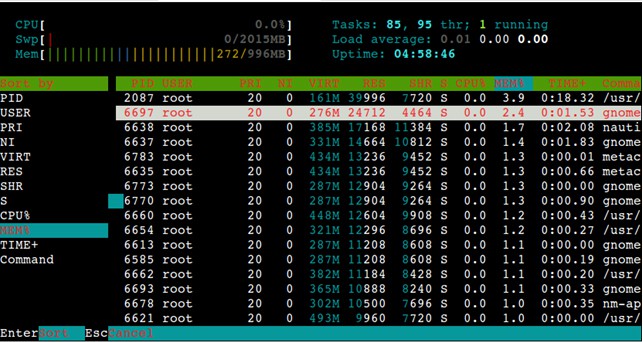
In my case, I am selecting Memory based sorting.
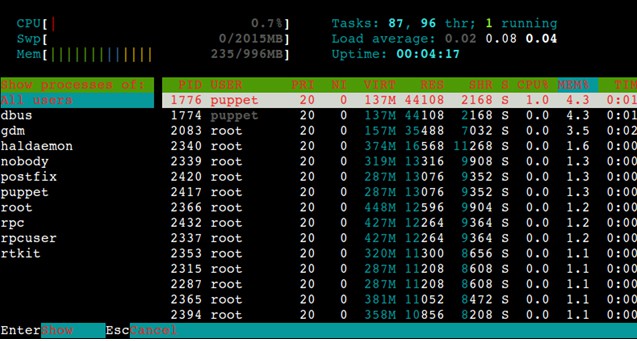
Display processes of a particular user
To display the processes of a particular user, press “u” and select the user as shown below:
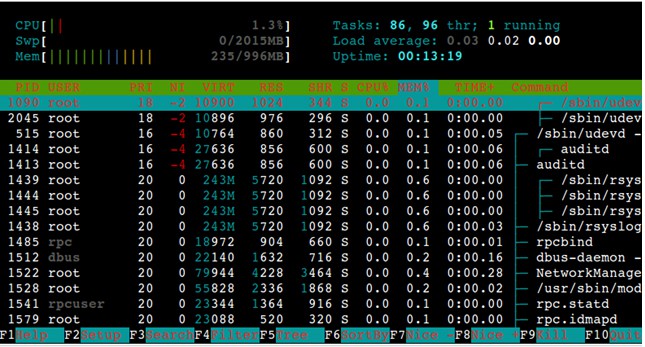
Display process tree
Press F5 or T to display the process tree.
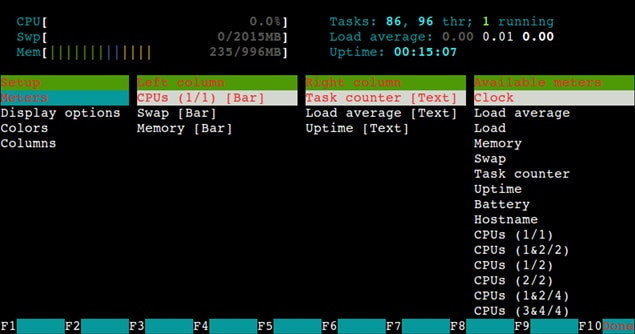
Display htop menu
To display the htop menu setup, press F2.